This contribution engages with the problem of crises for Europa. It applies a fragility lens to the problem since it is generally believed that fragile states are at a greater risk of causing security problems such as terrorism, regionalisation of conflict, CBRN proliferation, organised crime and mass migration. The contribution starts with a threat assessment for 2021 based on trend data from the past decade: what trends can be discerned and what do they mean for European security? Next, a brief analysis is given of international cooperation in this field: which actors are important? Above all, how is the rules-based system developing in this area? The contribution concludes with a comparison in which the question is asked whether the global system will be able to cope with the future threats.[1]
Threat assessment
Introduction
The conflicts in Syria, the fragmentation of Libya and repression in Egypt are salient examples of a much broader range of problems that potentially threaten the security of the EU and its Member States. Within the European security context, these problems have been designated as ‘crises’ since the 2003 security strategy, and efforts are made to minimise their negative effects through crisis management and prevention.[2]In the new Global Strategy, an explicit connection is made between the vital security interests of the European Union (EU), its Member States and crises: ‘fragility beyond our borders threatens our vital interests’. Fragility, it is reasoned, affects vital security interests by increasing the risk of conflict. Conflict can then create the right conditions for terrorist groups, organised crime and mass migration.[3]The EU has therefore formulated the challenging long-term ambition of supporting fragile states on the way to becoming ‘resilient, secure and sustainable societies’.[4] Roughly speaking, this ambition concerns a group of countries to the south and east of the EU (from Congo to Afghanistan).[5]
The following threat analysis identifies emerging trends within this subset of fragile states. The short conclusion is that the trends and outlook for 2021 justify pessimism. On the basis of the past decade, the picture is one of deteriorating fragility scores and various forms of violence, and there is a new group of low- and middle-income countries in crisis. This contribution also considers the extent to which this deterioration can be expected to also have implications for vital security interests (freedom from terrorism, organised crime and mass migration). The conclusion here is more positive: expected violations of vital security interests are out of step with the deteriorating scores and come primarily from less fragile countries.
The European focus on fragile states as the main risk carriers is widely shared in policy circles, but is problematic for at least three reasons.[6]Firstly, it remains unclear – despite all the research – exactly how fragility leads to problems such as conflict. All the fragility indices (the World Bank’s Harmonized List of Fragile Situations, the OECD (Organisation for Economic Co-operation and Development) 2015 Index and the Fragile States Index of the het Fund for Peace) include a large number of variables, without any clear view on the mix of factors that is potentially explosive.[7] What is clear, however, is that weak states as a group are involved in conflicts more often and pose a greater risk in this way.[8] Second, fragility is still often understood exclusively from a state viewpoint, which means that considerable intra-state differences or sub-national variations tend to be overlooked. Research into the impact of natural and other disasters, conflict development, locations of organised crime and fertile conditions for terrorism very often points to the local context as an important or even decisive factor.[9] In other words, while the consideration of state fragility remains useful for the general picture, country-specific information is essential for risk assessments.[10] Third, it is still open to question whether more intense fragility also implies potentially greater violations of the EU’s vital security interests. After all, the main crises from a European security perspective in the past five years have occurred in countries which, while appearing in the well-known fragility rankings, were by no means at the top of those rankings (Syria, Libya and Mali, the first two of which were even among the low- and middle-income countries). For these three reasons, this contribution makes a distinction between three groups:

The base rate
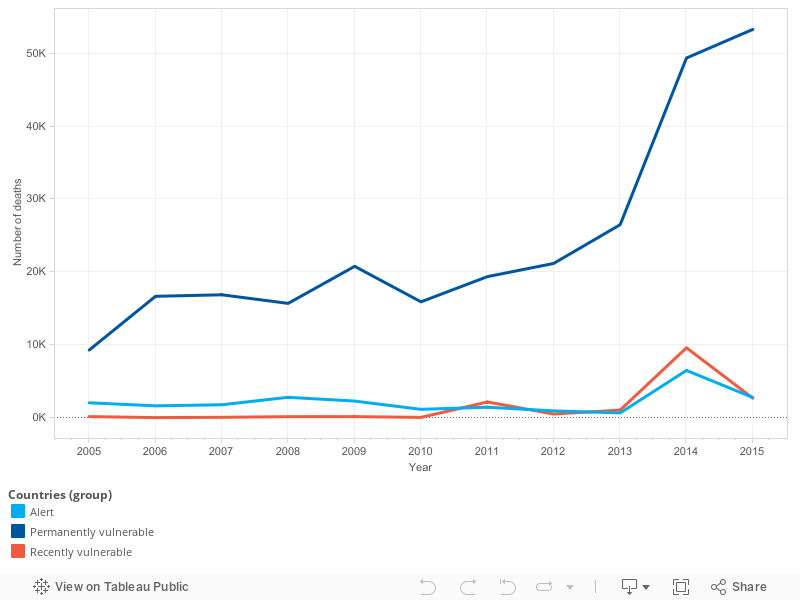
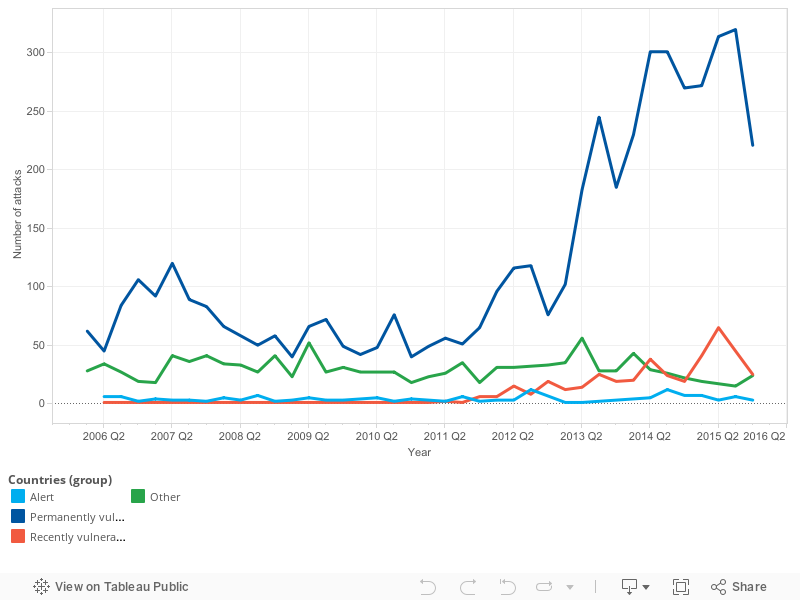
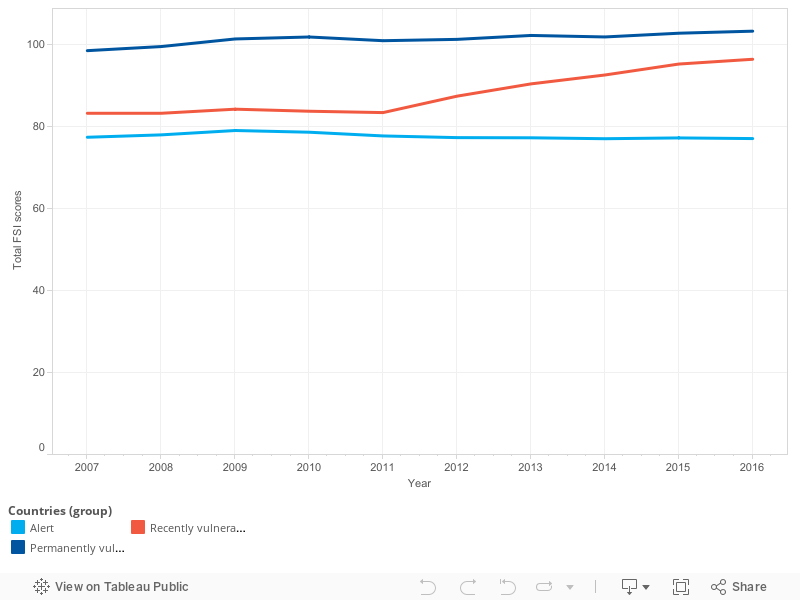
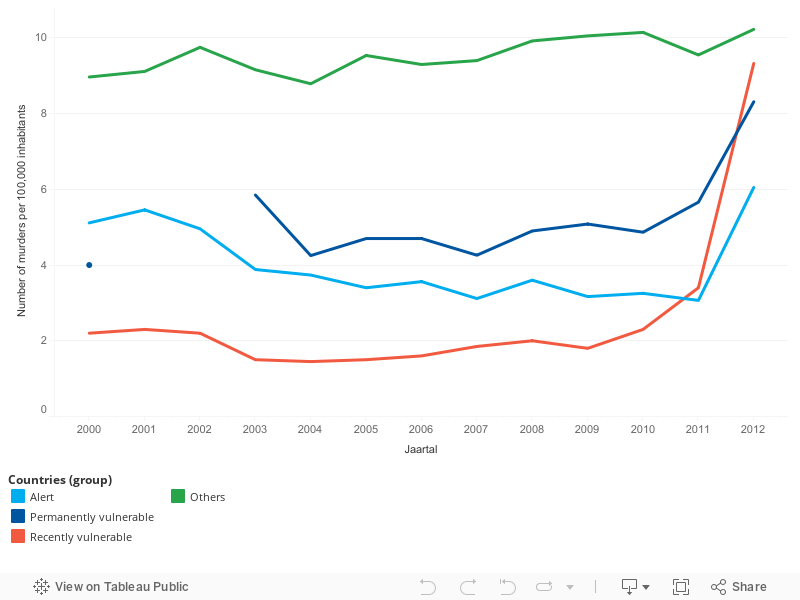
In general terms, there has been increasing fragility over the past decade in the region around Europe. A ten-year trend analysis (2006-2016) based on the Fragile States Index shows a slightly increasing fragility score for all three groups of states (see Table 1 and Figure 1). More worrying is that all the violence indices (number of conflict incidents, number of deaths, number of terrorist attacks and number of murders) show a rapidly deteriorating picture for both the recently vulnerable fragile states as well as the permanently vulnerable group of fragile states (see Figure A in the pop-out window).[12] On average, both groups are twice as likely to be involved in war and conflict as ten years ago (see Figure 2). Moreover, both the number of victims and the number of combat operations in these countries have more than tripled (see Figure B). A comparable picture emerges with regard to the number of terrorist attacks and to a lesser extent the number of murders as a result of criminal violence (see Figure C and 3).
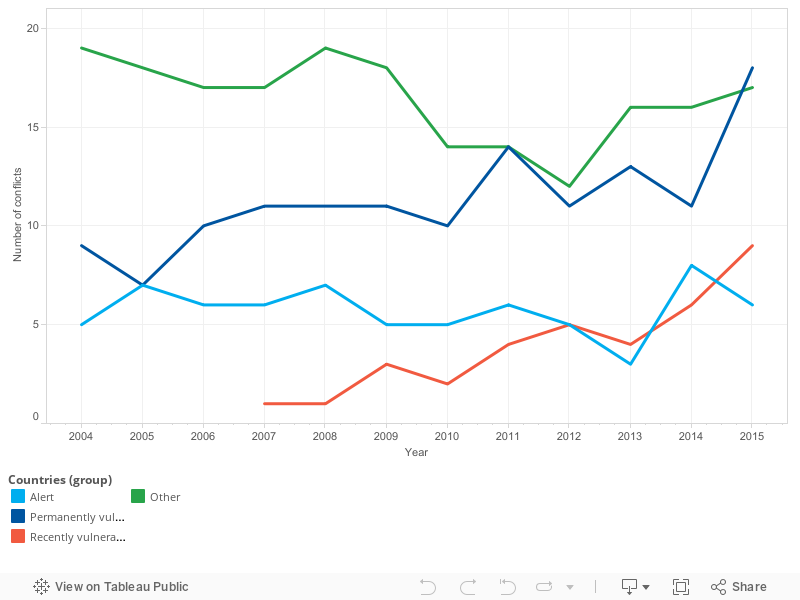
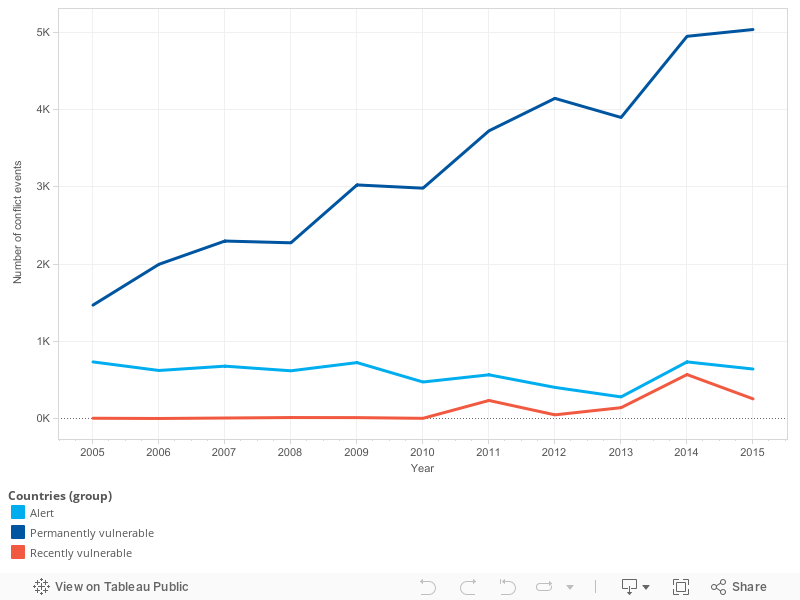
On the basis of these statistics, two general conclusions can therefore be drawn. First, the situation as regards violence faced by Europe is not the same as that at global level. At global level, there has been a slow decline in the number and intensity of various forms of violence, whereas in the region around Europe there is an opposite trend (especially in the Middle East and North Africa, but also in Sub-Saharan Africa).[16] Second, the relationship assumed by the Global Strategy between crises, fragility and violence is far more complex than the strategy suggests: the recent increase in violence (see Figure 1 and A) has been out of step with the only very slight rise in fragility scores. This weak correlation is another reason for not confining attention to the intensity of fragility in security assessments.
Determining factors
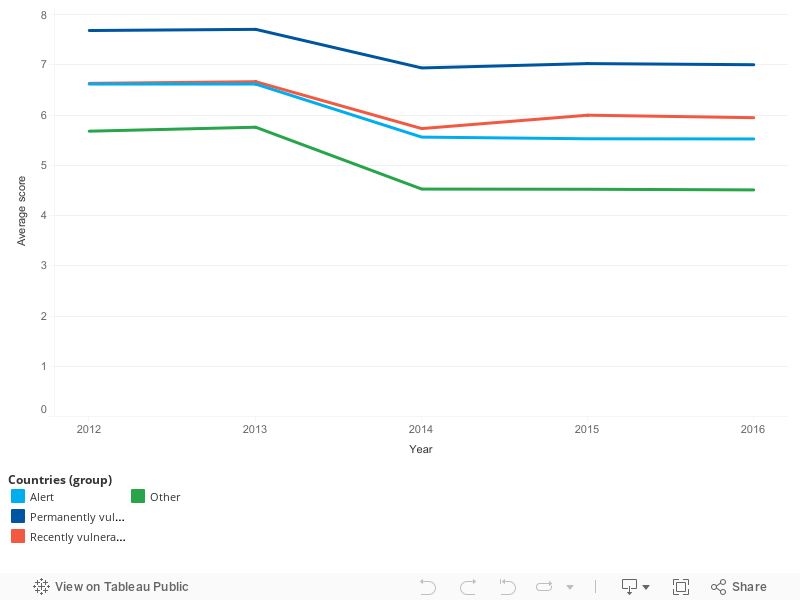
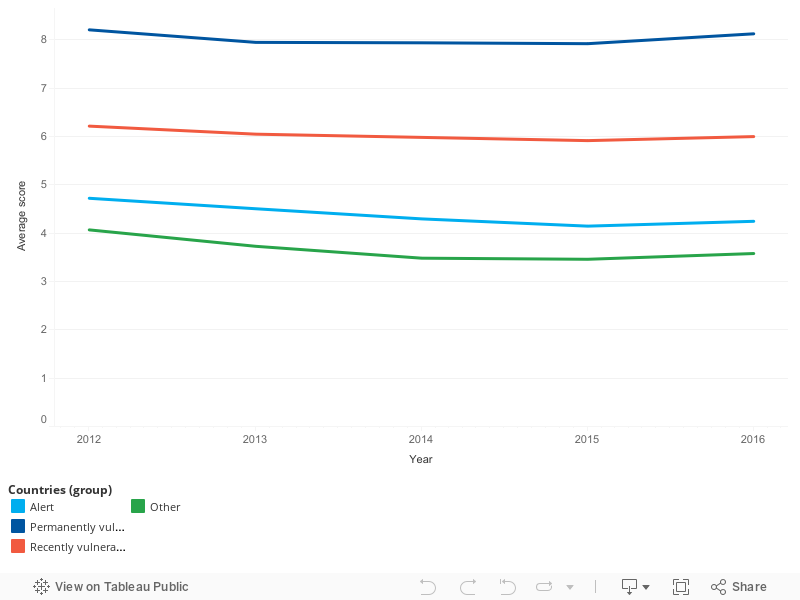
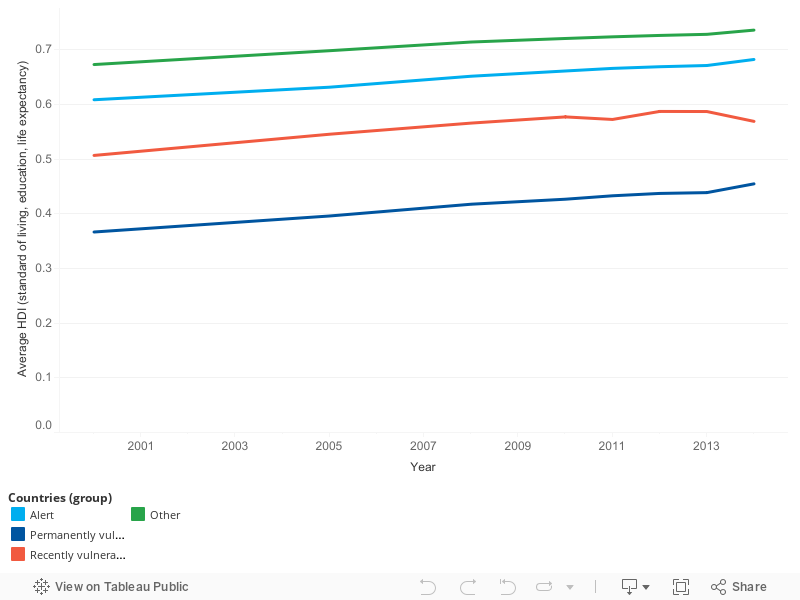
While the base rate suggests increasing problems, it is also necessary to take determining factors into consideration that affect fragility and the potential for conflict (see again Table 1). This contribution considers three factors; it is accepted that these are a more or less reliable way to measure the power of central governments, and that where the measured values are low, this means more fragility and more potential for conflict (thus a very poor economic position often turns out to be associated with both the outbreak and the persistence of conflict). Again, it should be noted that the causes of conflict are diverse, and that other causal relationships are conceivable. The three factors in this contribution that are central are ‘standard’ factors such as the economic outlook and trends, the financial situation of fragile states but also a third set of indicators which are accepted by the Global Strategy as reducing the potential for conflict: social resilience (see Figure 4, D and E).[17] To start with the latter, the general assessment for social resilience is positive. Several indicators for individual resilience show a slight improvement: the overall standard of living, life expectancy and participation in education are increasing slightly.[18] Two indicators for social resilience (institutional capacity and improving infrastructure) have also shown a slight improvement in the past decade.[19] However, these positive developments are virtually inapplicable to the group of recently vulnerable states, where (obviously) there has been continuing deterioration.
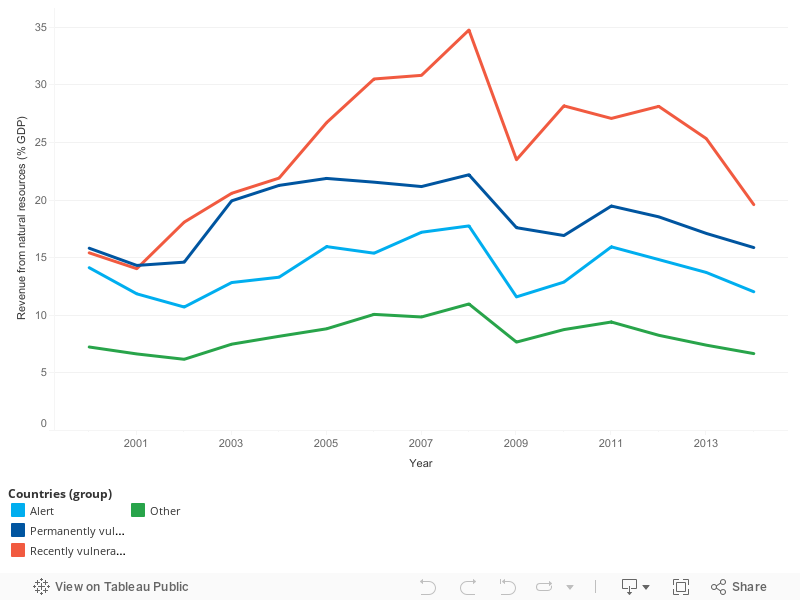
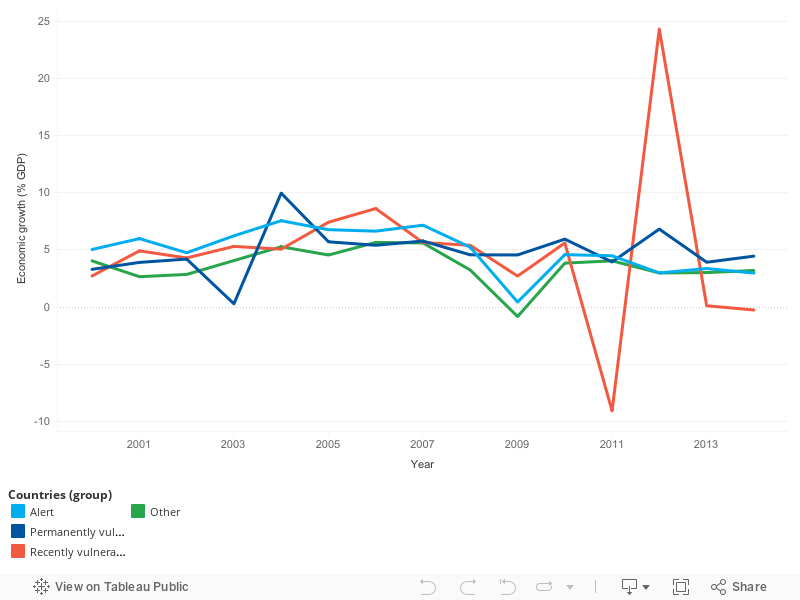
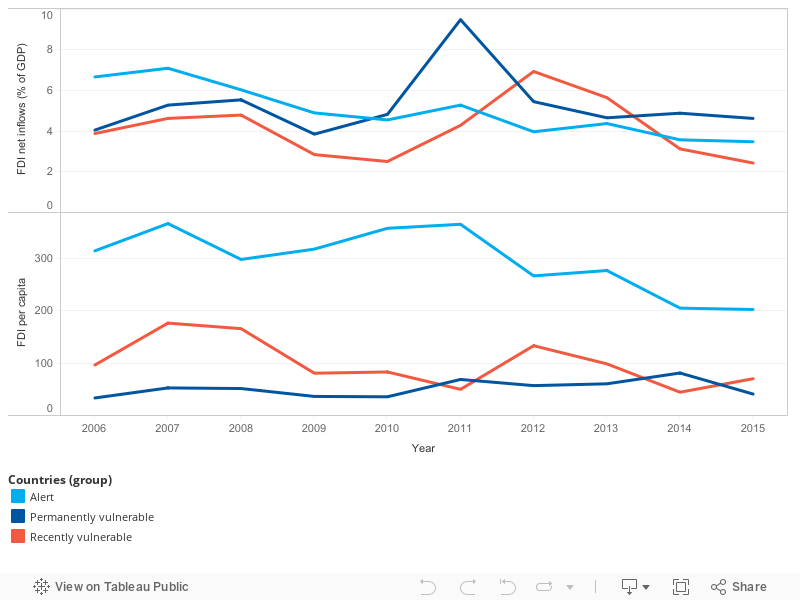
So much for the good news. Ten-year trends in economic developments seem far less positive (see Figure 5). Whereas permanently vulnerable states, because of their poor integration in the global economy, have suffered fewer adverse consequences from the global economic downturn (the financial crisis of 2007 and the collapse of commodity prices from 2014), the same is not true of the recently vulnerable states and the countries on alert. The GDP growth of both groups has gradually decreased. For all three fragility groups there has also been an observable fall since 2008 in the share of commodities in national revenue (see Figure F). This is especially a cause for concern for recently vulnerable states, virtually all of which depend to a great extent on income from commodities.[21] Permanently vulnerable countries, which are also highly dependent on the sale of commodities, have also been affected.
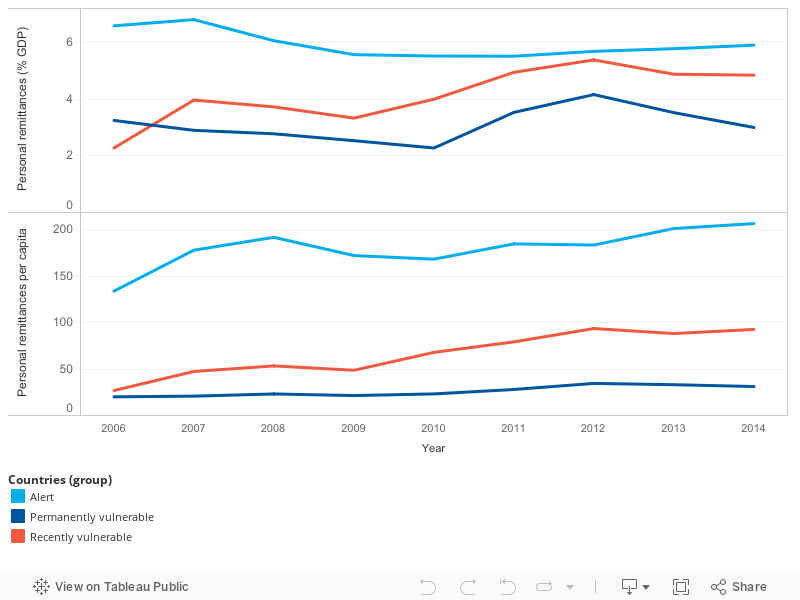
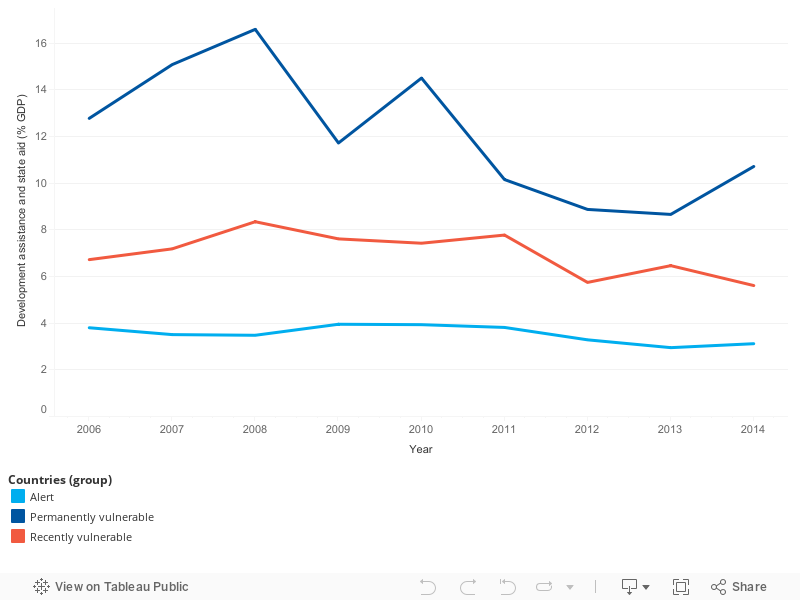
Finally, it is important to take account of the financial situation of fragile states in determining the outlook for 2021. Excluding debt relief, 10 to 17% of the GDP of fragile states comes from aid (official development assistance (ODA) and other official flows (OOFs)), investment and remittances (see Table A).[23] The trend is that all three groups are experiencing decreasing state revenues. In the area of development, bilateral aid and even remittances, fragile states are facing a downward trend, by contrast with the trend globally.[24] Figure 6 shows a decline in ODA from the Development Assistance Committee (DAC), but also in OOF-type multilateral and bilateral aid for all three groups of states.[25]
|
Year |
|||||||||||
|---|---|---|---|---|---|---|---|---|---|---|---|
|
Countries (group) |
2006 |
2007 |
2008 |
2009 |
2010 |
2011 |
2012 |
2013 |
2014 |
2015 |
|
|
Alert |
Ave. net ODA and official aid received (% of GDP) |
3.80 |
3.51 |
3.48 |
3.95 |
3.93 |
3.82 |
3.28 |
2.95 |
3.12 |
|
|
Ave. Foreign Direct Investment (FDI), net inflows (% of GDP) |
6.66 |
7.09 |
6.03 |
4.90 |
4.55 |
5.28 |
3.97 |
4.37 |
3.57 |
3.48 |
|
|
Ave. remittances received (% of GDP) |
6.58 |
6.80 |
6.06 |
5.57 |
5.52 |
5.51 |
5.68 |
5.78 |
5.90 |
6.40 |
|
|
Permanently vulnerable |
Ave. net ODA and official aid received (% of GDP) |
12.77 |
15.08 |
16.59 |
11.72 |
14.50 |
10.15 |
8.87 |
8.66 |
10.71 |
|
|
Ave. Foreign Direct Investment (FDI), net inflows (% of GDP) |
4.05 |
5.28 |
5.54 |
3.85 |
4.82 |
9.48 |
5.45 |
4.65 |
4.88 |
4.62 |
|
|
Ave. remittances received (% of GDP) |
3.25 |
2.90 |
2.78 |
2.53 |
2.27 |
3.53 |
4.16 |
3.52 |
3.00 |
1.39 |
|
|
Recently vulnerable |
Ave. net ODA and official aid received (% of GDP) |
6.72 |
7.18 |
8.34 |
7.61 |
7.42 |
7.77 |
5.74 |
6.46 |
5.61 |
|
|
Ave. Foreign Direct Investment (FDI), net inflows (% of GDP) |
3.88 |
4.63 |
4.79 |
2.85 |
2.51 |
4.28 |
6.93 |
5.65 |
3.13 |
2.43 |
|
|
Ave. remittances received (% of GDP) |
2.27 |
3.96 |
3.72 |
3.33 |
3.99 |
4.94 |
5.38 |
4.87 |
4.84 |
1.99 |
|
This is somewhat contradicted by all the positive coverage of remittances; with the exception of the recently vulnerable fragile states, there has been a constant or even a downwards trend in remittances (by individuals) (see Figure G).[26] Investments in fragile states are also decreasing, and broadly follow the downwards global trend (see Figure H). In particular, a number of countries on alert (Jordan, Saudi Arabia, Turkey and the Balkans) have experienced significant declines.
A final factor relates to the deployment of peace missions as an important preventive mechanism. Although the effectiveness of such missions is dependent on many factors, a particular type (transformational/multidimensional missions) can have positive effects on the duration of the peace and the intensity and duration of violence.[28] Trend data concerning missions of the United Nations (UN, about a third of all missions) show an increase in the number, right type (transformational/multidimensional) and size of missions. At the same time, this means seems to be gaining in popularity mainly for the group of permanently vulnerable countries; the recently vulnerable countries are still an unlikely destination for such missions.[29] In other words, in the most positive case this instrument primarily affects permanently vulnerable countries.
Impact and shocks
The million-dollar question, of course, is to what extent this deteriorating outlook leads to greater threats to the EU’s vital security interests (defined as terrorism, crime and migration)? The easy answer is that more conflict and weaker states pose a greater threat to the EU because there are more refugees and more opportunities for terrorist groups and organised crime.[30] However, there is little evidence for this conclusion: recent research even indicates ‘flimsy empirical foundations of the conventional wisdom about the dangers posed by weak states’.[31] A better, but general answer is that on the basis of both the recent past and evidence-based research, it is mainly the group of recently vulnerable countries that causes security problems. It is known that the current terrorist threat comes primarily from Syria and to a lesser extent from Libya, and research has shown that weak but relatively well functioning and reasonably integrated countries form the most attractive base for terrorist groupings.[32] A similar expectation applies to organised crime: most crimes (drug transit, human trafficking, people smuggling) benefit, like terrorism, from weak but relatively well-functioning countries.[33] Regarding migration, the outlook is more pessimistic. The general pattern is that migration is primarily driven by violence (refugees) and economic conditions (migrants).[34] In other words, the negative outlook for the permanently vulnerable and recently vulnerable countries will probably produce a higher migration potential.[35]
The above forecast is based on observable trends. At the same time all kinds of uncertainties and sudden events are imaginable which would require a different assessment. To take this into account, a number of possible events have been identified and scored by the Clingendael Expert Survey (see Figure I). The three main conceivable shocks in terms of crises (a more isolationist United States, the collapse of the EU and a Russian attack on the Baltic States) only have a limited impact on the observed trend: the collapse of the EU might have negative effects on cooperation over migration, while a Russian attack could lead to more migrants. All in all, the findings of the survey of experts support the earlier analysis.
To summarise, for both the permanently vulnerable group and the recently vulnerable group a deteriorating situation has been observable for the next five years: there has been far more violence and, with the exception of the human development indices, economic and financial outlooks generate the expectation of more violence and fragility in the period to 2021. At the same time, this trend does not necessarily lead to an increased European security problem: it is mainly the recently vulnerable countries with a reasonable infrastructure that pose a threat. This conclusion raises the pressing question of whether the European ‘fragility’ lens is the right one to detect potential threats to the EU. On the basis of this analysis, it seems that it is in fact countries that are comparable to Syria, Libya and Mali, and not high in the fragility rankings (countries such as Turkey or Moldova, for example), will have the most impact purely from a security perspective. In that respect this analysis – with all its limitations – offers cause for some optimism: for the group of countries on alert the outlook is stable.

Shock
The crisis regime
There are at least four different international policy areas that are designed to address and mitigate the problems that fragile states entail: development policy (in particular a set of agreements for fragile states), the humanitarian sector (including emergency assistance), the instrument of peace operations and, to a lesser extent, cooperation in the field of migration.[36] Although each area is characterised by its own set of institutions, norms and procedures, they are increasingly tending to converge, to the point where one can speak cautiously in terms of a crisis regime. The central question in this second section is how the international order is developing in this specific policy area.
Based on the available evidence over the past decade, two conclusions can be drawn. First, the crisis regime is rather weak, because important state and non-state actors continue to disregard the rules, so that the whole system thus has a limited ability to take successful action. Second, despite this, the crisis regime seems to be growing stronger rather than weaker.
Actors and institutions
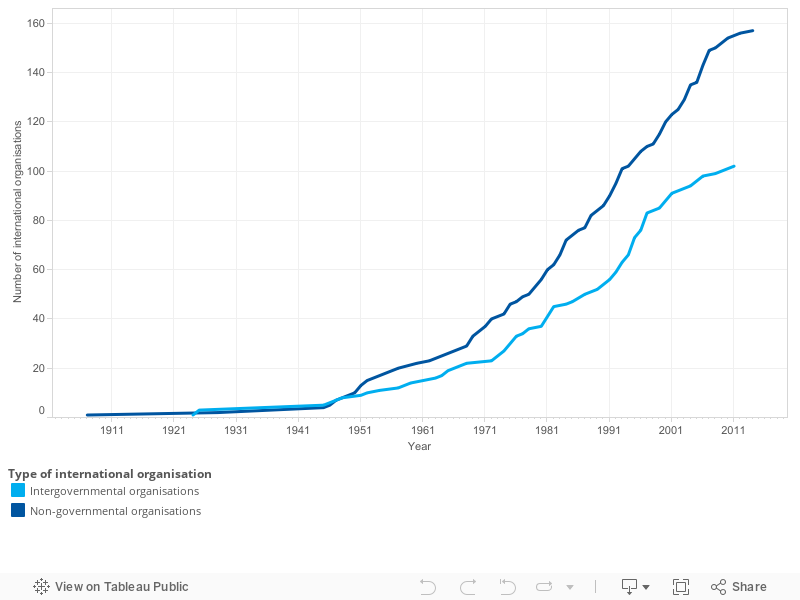
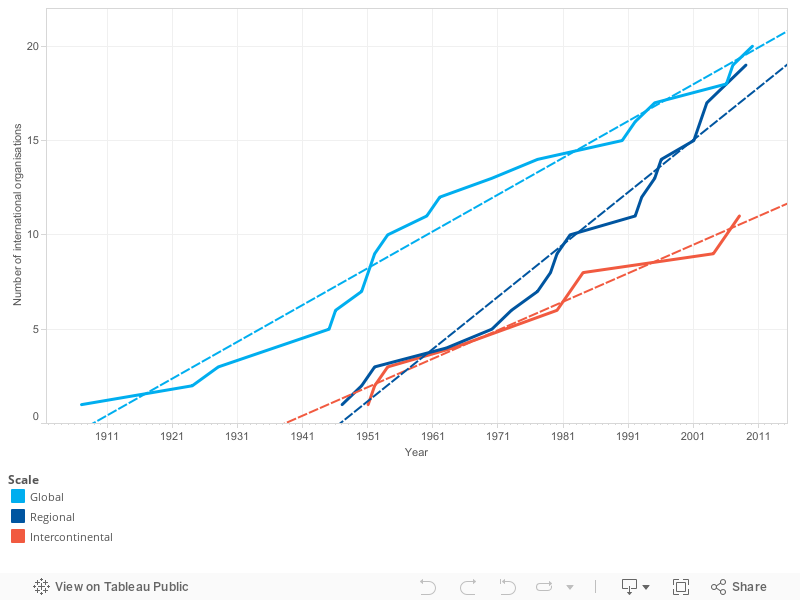
In general terms there is a globally organised system in all four policy areas in which regional organisations and solutions gradually seem to be claiming a more prominent role. In addition, the role of non-state and non-traditional actors in tackling and resolving problems is increasing. Quantitative data gives a first indication. Figure J shows that – not surprisingly – there are more non-governmental than intergovernmental organisations (especially since 2000). Moreover, Figure K shows that there is an upward trend in the number of regional organisations.
A more qualitative approach gives a somewhat better understanding of both developments. An analysis of the most important gatherings in each area shows a similar picture. Development policy towards fragile states remains substantially dominated by a more or less globally organised system with broad multilateral organisations such as the OECD, a set of UN institutions and various development banks.[37] In addition to these multilateral organisations, there is a tangled web of regional organisations (the EU, the Association of Southeast Asian Nations (ASEAN)), traditional state actors (DFID,[38] US-AID)[39], new state players outside the OECD framework (the BRICS,[40] the Gulf States) and non-state actors. The active role of civil society and the G7+ during the negotiations in Busan and the development of the Sustainable Development Goals agenda show that non-state actors have gained a stronger role in decision-making.[41] Humanitarian aid, the policy area for direct crisis assistance, is also mainly organised globally (UN-OCHA,[42] IASC)[43] with a significant role for non-state actors (such as a great range of aid organisations) in decision-making (e.g. decision-making about the Transformative Agenda, the Humanitarian Summit and the Grand Bargain).[44]
In the area of peace operations, decision-making is organised globally, but there is a prominent role for regional actors. Although the UN Security Council (UNSC) remains the only body that authorises such operations, in their implementation a hybrid form of cooperation has arisen between global and regional players. Various UN units are responsible for a third of the missions (but supply more than half of the personnel), while regional organisations and ad hoc coalitions are responsible for the remaining number (NATO, EU, AU, ECOWAS, OSCE).[45] This situation has been stable for the past decade or so.[46] With regard to international cooperation in the field of migration, there is a global framework (the Refugee Convention (51), Additional Protocol (67) and a worldwide organisation (UNHCR).[47] At the same time, almost all policy on refugees is organised nationally, or in some cases regionally, rather than globally.[48]
Norms and rules
Tables 2 and 3 show some of the most important global norms and rules in each of the four policy areas. Without going into all norms and rules individually, there are several examples of concrete agreements (rules) in the area of development cooperation: a set of priorities and agreements between fragile states (the G7+), donors and civil society (the New Deal); an important (Westphalian) norm in the refugee regime that states only have obligations if refugees are outside their country of origin (‘Internally Displaced Persons’ (IDPs) have no status).[49] Based on a summary of important discussions in each individual policy area, two notable trends in the area of norm and rule development can be identified.
|
Peace and state-building |
Peace missions |
Humanitarian action |
Refugees |
|---|---|---|---|
|
(Re)construction of fragile states (Westphalian norms) |
The national government should be in charge |
Neutral, impartial, independent |
A refugee is someone who is outside his/her own national borders (Westphalian norm) |
|
Universal norm in order to take all countries out of fragility (no one should be left behind) |
For peace missions consent, impartiality and restraint are needed |
Protection of people in need, regardless of where they are located |
Non-refoulment norm (prohibition on sending people back where there is danger) |
|
OECD-DAC norm (0.7% ODA/GDP) |
Peace missions for building and maintaining peace |
|
Peace and state-building |
Peace missions |
Humanitarian action |
Refugees |
|---|---|---|---|
|
The New Deal sets the direction of fragility reduction efforts: FOCUS, TRUST, PSG |
The UNSC leads the peace missions and delegates tasks to regional organisations |
The Inter-Agency Standing Committee (IASC), the umbrella system for the coordination of the response |
UNHCR as the main coordination point |
|
Financing coordination is undertaken by OCHA and the donor fund |
Funding mechanisms |
CERF and CBPFs[50] (financing schemes) by OCHA |
Refugee status ‘in the region’ |
|
The ‘local’ (i.e. national) level takes the lead |
Split response (institutional, PBC etc. [51]) |
Financing procedures |
First, a more significant overlap has arisen between the four policy areas. This is most clearly expressed in the consensus that exists on the need to reduce violence (also known as the ‘violence reduction paradigm’).[52] In the development debate, publications such as Breaking the Conflict Trap (2003) have culminated in a widely shared focus on tackling and preventing conflict (see SDG 16 and the entire fragility discussion).[53] The humanitarian field – despite fears of the securitisation of aid – now devotes more resources to conflict relief than to (natural) disasters.[54] Lastly, peace operations have increasingly had a construction dimension. The operations are now supposed to help eliminate the root causes of conflict.[55] Other dimensions in which policy discussions overlap (or are beginning to do so) are the call for more prevention and the widespread and widely accepted call for the ‘localisation’ of relief, development and peacebuilding.[56]
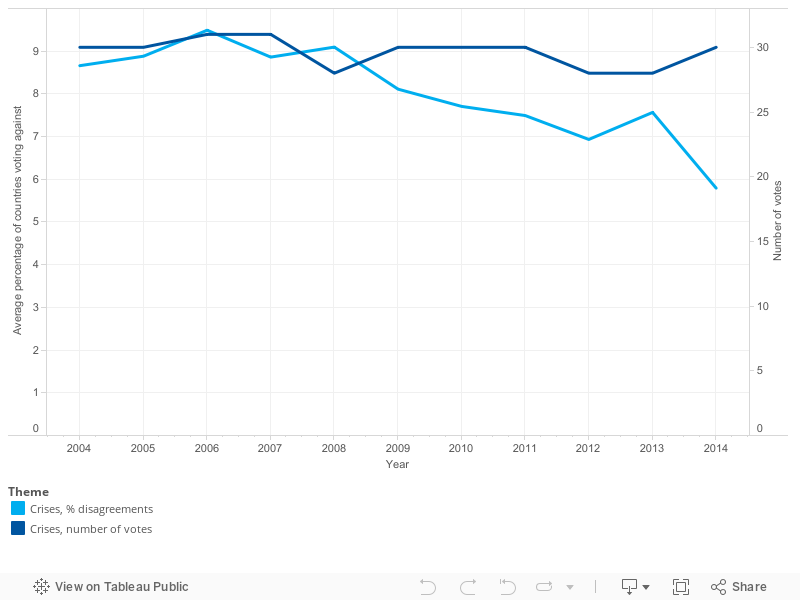
Second, existing rules have been improved. The Peacebuilding Commission (2005-2006) and the Peacebuilding Fund (2007) have emerged as part of the peace operation toolkit. Both represented a practical response to a more than ten-year call for better coordination of segregated UN activities and the closing of the gap between development and security policy. In addition, the mandates (and hence the toolkit) of missions have been significantly extended.[57] Better rules have also been defined for development and humanitarian aid, often based on evidence-based principles.[58] Well-known examples include the New Deal and the CERF and CBPFs, the relief funds of OCHA. Quantitative information supports both trends: on the basis of voting behaviour in the General Assembly, opposition between states seems to be decreasing (see Figure L).
These positive trends aside, the development of norms and rules has been a very slow process. Virtually all discussions have amounted to nothing more than ‘the same, except more’.[59] Ten years ago, as today, the topics were protection of civilians (in the context of peace operations), the need for better cooperation between UN institutions (all policy areas) and the gap between ‘capabilities-expectations’ (all policy areas). Moreover, there are now fresh challenges (such as non-traditional donors or the growing number of IDPs) for which there are neither rules nor norms.[60]
Compliance
The big problem facing the ‘crisis regime’ is not the lack of relevant norms and rules but the fact that rules are regularly flouted. In the area of peace operations, the problems are relatively minor. HIPPO (High-Level Independent Panel on Peace Operations) has drawn attention to a lack of resources and continuing tensions within the UN (similar to the conclusions of the Brahimi report 15 years earlier).[61] Moreover, the Peacebuilding Commission has been unable to assuming the leadership position that was envisaged.[62] For development policy, the picture is less rosy. In the run-up to the New Deal, there was already a series of pledges of renewed dedication. Since 2011 little has changed in practice, however. A research report from 2016 concludes that there has been no improvement, that major (institutional) donors have de facto withdrawn and that there is a need for renewed commitment.[63] While increasing in absolute terms, development assistance has failed to meet the OECD-DAC norm, and when the figures are adjusted for GDP growth there has even been a decrease.[64]
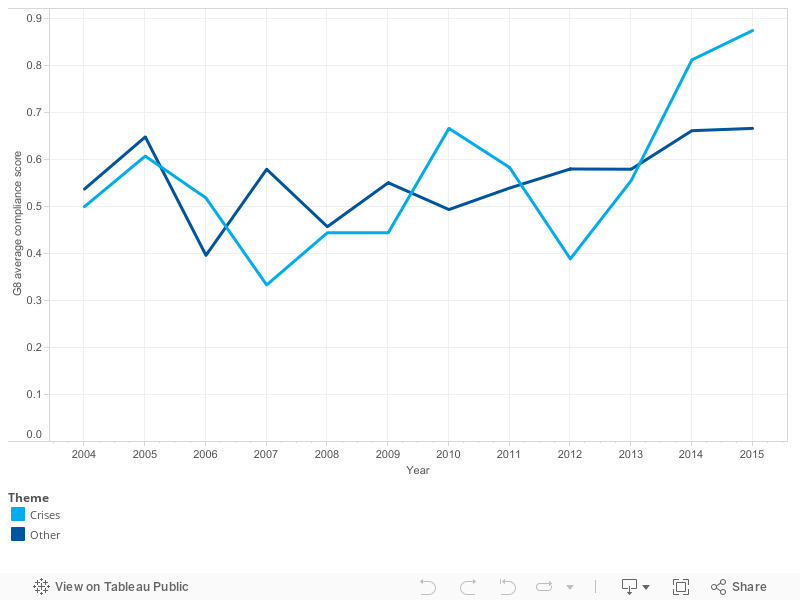
Within this overall trend of conflict over rules, there are signs of improvement, however. Quantitative data on compliance with pledges by the major world economies (the G8) in the area of aid, migration and peace operations shows increasing compliance with pledges (33% compliance in 2007, 85% in 2015 (see Figure 7)). Qualitative information confirms this assessment for peace operations and development assistance: troop and financial contributions have increased and the BRICS (excluding Russia) have, often for pragmatic reasons, backed the deployment of peace missions.[65] In absolute terms, development aid (and humanitarian aid) are increasing, and are increasingly being deployed in fragile states as agreed.[66]
The quadrant chart and shocks
Where does the crisis regime stand and what can be expected between now and 2021 (see Figure 8)? Based on the above analysis, three conclusions can be drawn. First, despite the significant role of non-state actors in implementation, the regime is still dominated by state actors. Second, there is a fairly well developed international regime, in which, however, there is still frequent conflict over existing rules. Notwithstanding conflict, there is nevertheless a cautious trend emerging towards better compliance with existing rules. Thirdly, this is a very slowly evolving regime which, despite the pressure that is on the system and the emergence of new world powers, is occasionally able to reach agreement on fundamental norms and practical rules.

In the case of the crisis regime, just as elsewhere, expected trends may change as a result of sudden events. To take this into account, a number of possible events were also identified and scored by means of the Clingendael Expert Survey for the system of cooperation (see Figure M). The wisdom-of-the-crowd suggests that in almost all cases it is unlikely that any of the five shocks will occur. At the same time, the impact varies. Events such as a new financial crisis or the collapse of the EU would probably have a major impact on the crisis regime. In the first of these two cases, the willingness to remain within the existing rules would probably decrease, while the EU’s collapse would affect the conduct of peace operations and normative developments such as the New Deal. To summarise, the trends are not robust in the event of unexpected shocks.

Shock
Conclusion
This contribution concludes that the trends and outlook for 2021 with respect to fragile states give cause for pessimism, but that the deteriorating situation is also unlikely to result in a much greater threat to European security than is currently the case. In addition, this contribution concludes that there is a very slow but positively evolving form of international cooperation. Nevertheless, international cooperation can only be expected to make a very limited contribution in the next five years. First, cooperation is improving but the problems are increasing too. There is an ever-widening gap between needs and funds.[68] Second, the Middle East and North Africa is a region where instruments such as peace operations traditionally have scarcely been deployed (perhaps because it would scarcely have been possible to do so), and the conflicting interests of (regional) major powers appear in practice to sideline the crisis regime.